
Reading Profit & Loss
Profit & Loss shows the shop's sales, the cost of goods sold, the expenses and the net profit for one period.
On this page
Profit & Loss answers the question "how much did the shop make this month?". Open Reports → Profit & Loss, then press a period button such as This month or Last month, or choose From and Until yourself. To follow it month after month, use Month by month.
Profit & Loss is only open to holders of the Sensitive Reports role, for example the owner and the Finance Head. See Roles and permissions.
The report from top to bottom
- Sales: Sales of Goods and Service Revenue (Service Revenue shows when the Services feature is on or a service was ever sold), then the income categories under operating income (Operating Income and its children), less Sales Returns and Sales Discounts. The result is Net sales.
- Cost of Goods Sold (COGS): the cost price of the goods that were sold. A shop that produces can open it into materials, wages and factory costs. See Cost of goods sold breakdown. Inventory Losses and the stocktake surplus (+) can show here too, as in the periodic (physical) method. See Stock differences in cost of goods sold. Its periodic (physical) method calculation, from opening stock to closing stock, can show below the report. See Cost of goods sold calculation.
- Gross profit: net sales less COGS.
- Expenses: the business expense categories, laid out as under Master Data → Expense Categories: Operating Expenses at the top, then Salaries, Electricity, Rent and the others under it. This includes the monthly share of prepaid expenses. The sum is Total expenses.
- Other charges: charges Vende records itself, for example Inventory Losses, Cash Over and Short, Interest Expense, Depreciation Expense and Promotion Expense, then the expense categories outside the business (Non-operating Expenses and its children, or another top category marked Under other charges (outside the business)). The sum is Total other charges.
- Other income: other income Vende records itself, then the income categories outside the business (Non-operating Income with Bank interest and its other children). The sum is Total other income.
- Net profit: gross profit less total expenses and total other charges, plus total other income. A negative figure means a loss.
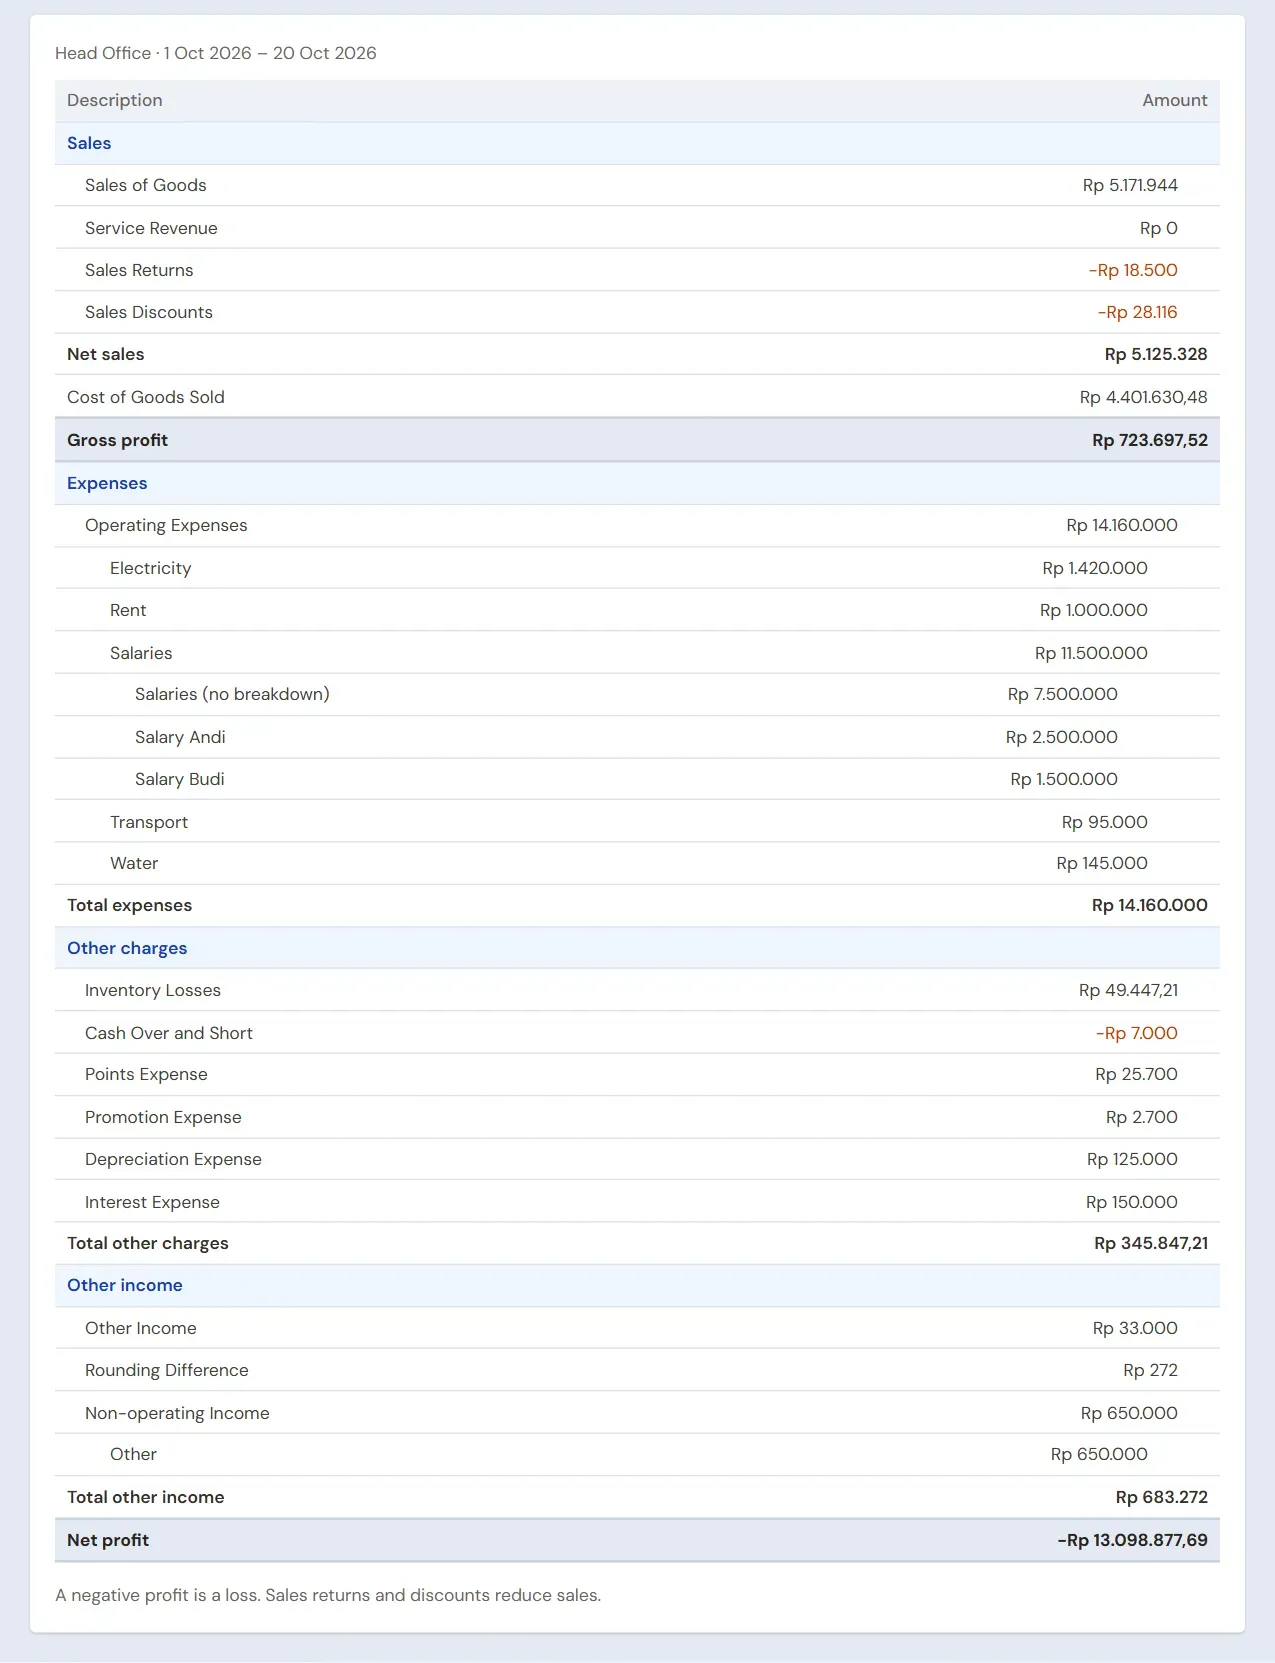
Expenses, other charges and other income that did not move in the period are not shown.
The lines inside each part are indented, both their names and their figures. The figures of Net sales, Cost of Goods Sold and every total stand at the far right. See Indented rows.
Comparing with another period
After the period buttons come View and Compare with, beside them or below them, depending on the width of the screen. Your Compare with choice shows as a second column beside your period:
- Previous period: a period as long just before. This month is compared with the same days last month, for example 1 to 19 October with 1 to 19 September. Last month is compared with the month before, Last 3 months with the three months before, and Last 12 months with the twelve months before. Last 7 days is compared with the 7 days before, and Today, Yesterday or a single date with the day before.
- Last year: the same days a year earlier, for example This year (1 January until today) with the same days last year.
- None: no second column.
The choice stays when you change the period. So to see this month against last month, press This month and Previous period. Each column's heading names its dates. The PDF and the Excel file hold both columns. On a phone both choices are in the Period and Compare with menus.
Month by month
To follow the shop month after month, choose View: By month. When the period on screen is only one month, for example This month, the report moves to Last 12 months at once: this month and the eleven before it, until today. The other period buttons work too, for example Last year for January to December last year, or pick the dates yourself. A one-month period always shows in one column: when you press This month afterwards or pick dates inside one month, the view goes back to Whole period.
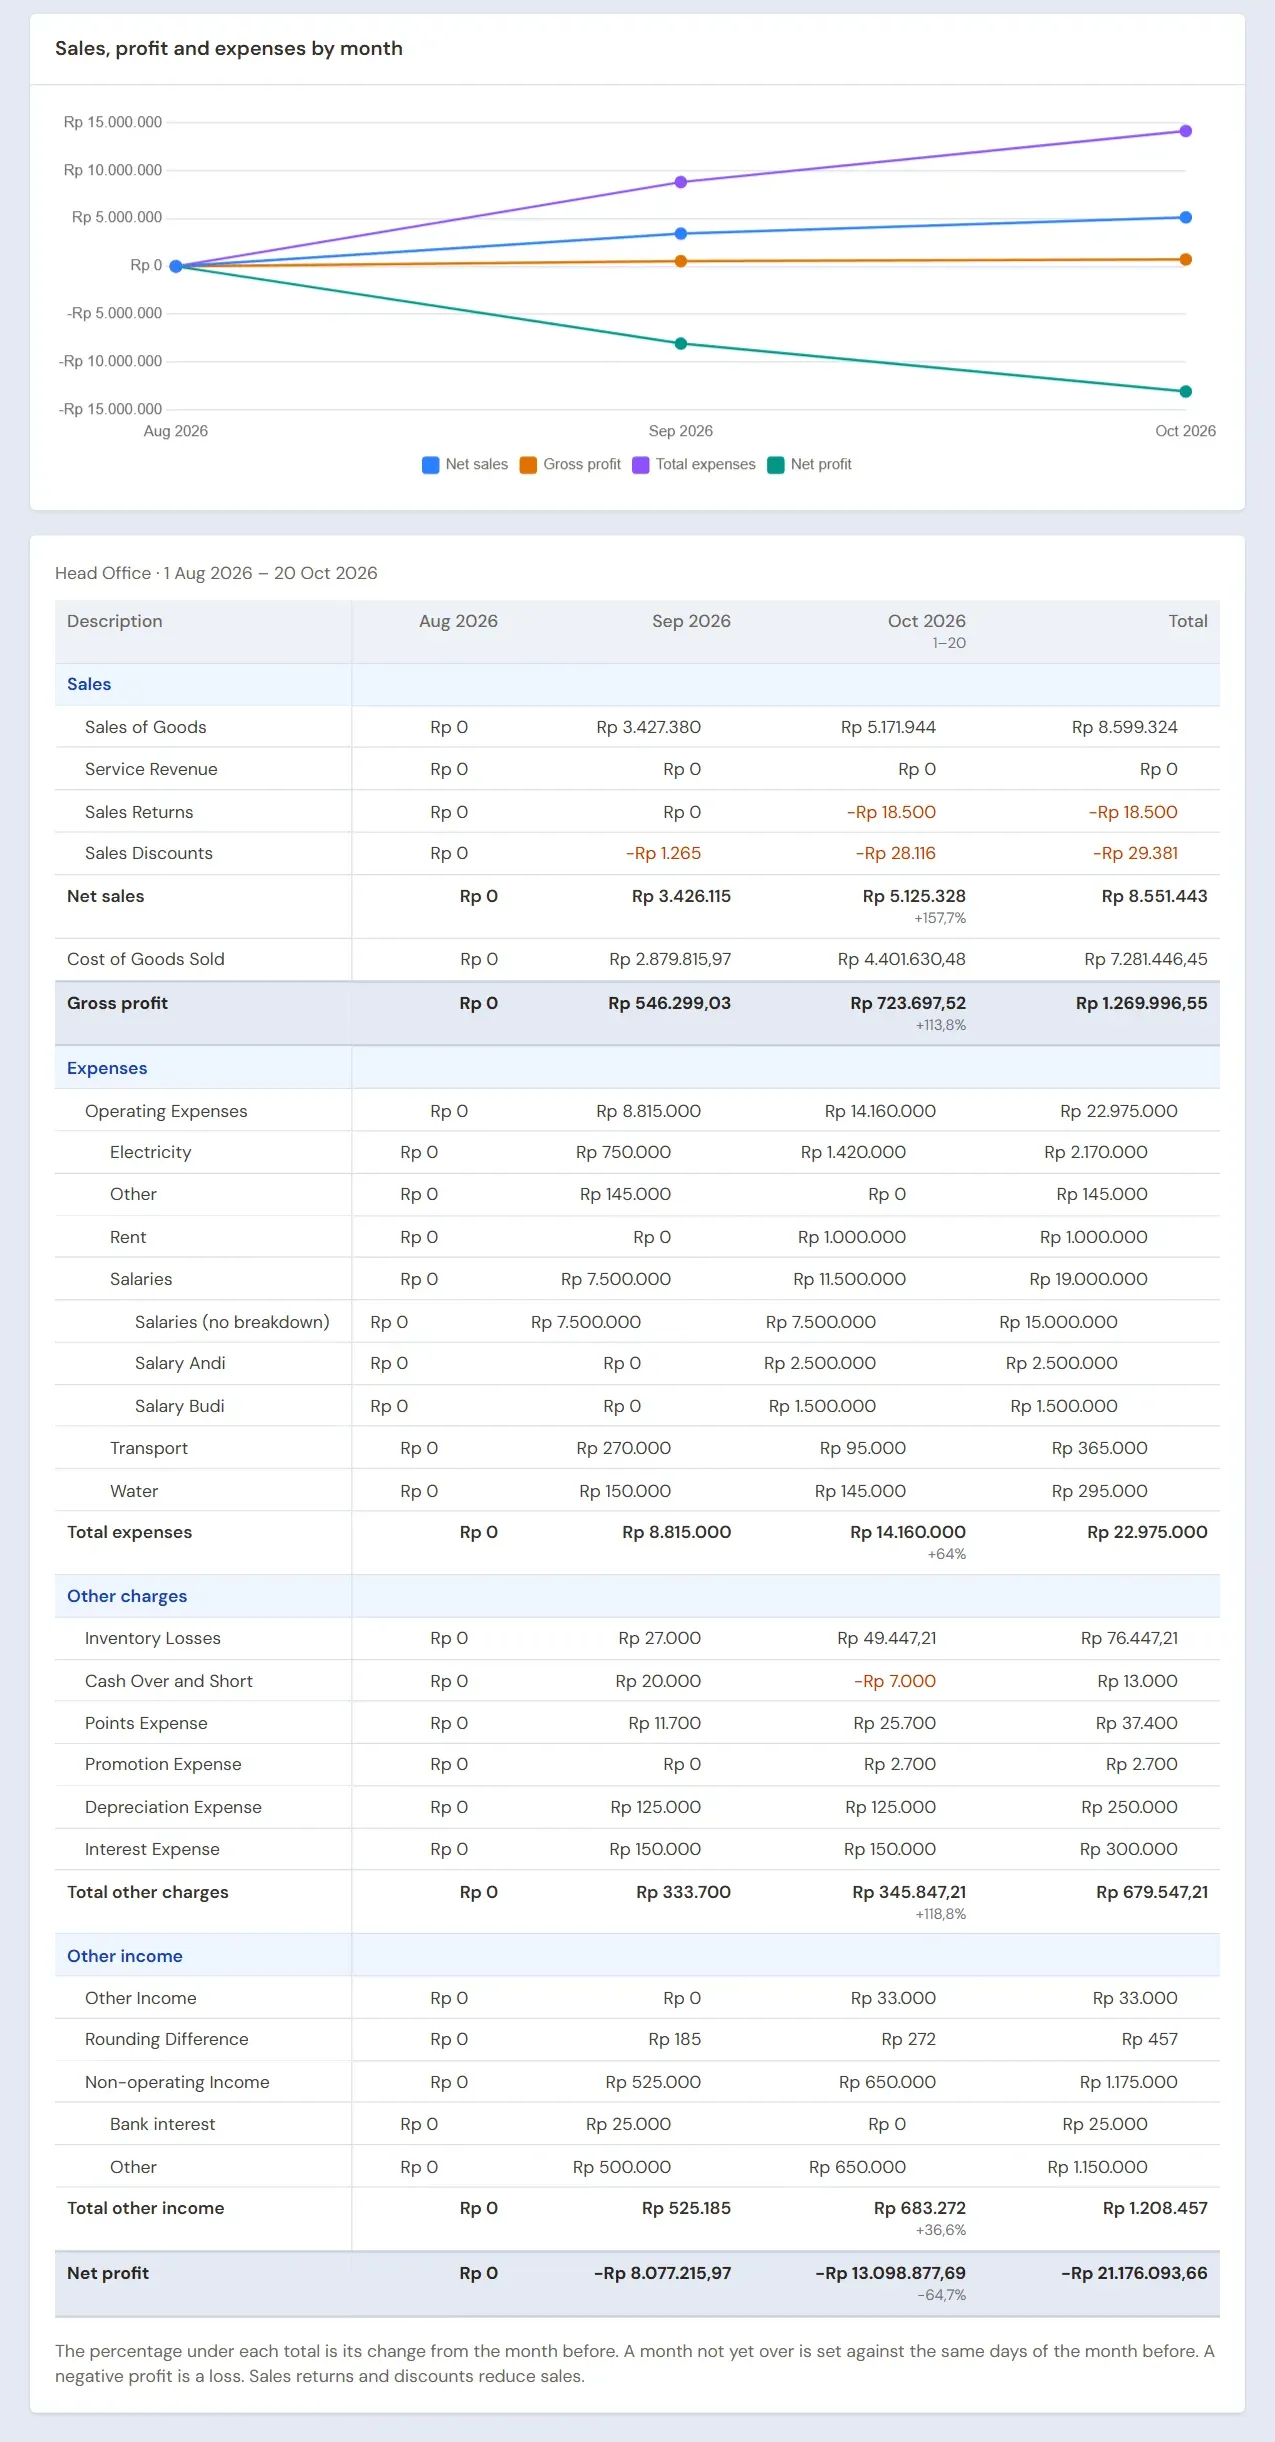
- Every month is a column, the oldest on the left, then a Total column for the whole period. Each month's figures are exactly the Profit & Loss of that month on its own.
- A month that is not whole, such as this month until today, names its days under the month, for example 1–20.
- Under the figures of Net sales, Gross profit, Total expenses, Total other charges, Total other income and Net profit is their change from the month before, in percent. A month that is not whole is set against the same dates of the month before, for example 1 to 20 October against 1 to 20 September, or 15 to 31 July against 15 to 30 June. No percentage is written when the month before is zero.
- Above the table a chart shows net sales, gross profit, total expenses and net profit per month. Touch or point at a month to see its figures.
- The Description column stays in place while the table scrolls sideways.
- On a phone every month is a card, the latest first. Press Details to see all of its lines.
- The PDF prints across the page, six months a table. The Excel file holds every month and, under each total, a row with its change in percent.
- One view holds at most 24 months.
For example: total expenses of Rp 1.000.000 in September and Rp 1.200.000 in October show +20% under October. A loss that shrinks also goes up: a net profit of -Rp 100.000 that becomes -Rp 50.000 shows +50%.
While the by-month view is in use, Compare with is not shown, since every month is already set against the month before. Choose View: Whole period to go back to one column.
Profit & Loss per warehouse
When the shop has several warehouses, pick Warehouse above the report to read one warehouse only:
- The report shows Net sales, Cost of goods, Gross profit and Margin (%) of the notes made from that warehouse. The figures are read from the notes' journals, so they equal Profit by Note for the same warehouse. The cost of goods sent by Surat Jalan (delivery note) counts for the warehouse of its sale note, even when the goods left another warehouse.
- Net profit is not shown for one warehouse. Costs such as salaries and electricity are booked per branch, not per warehouse, so there is no honest way to split them. Vende does not invent an allocation; the report writes this note under the table.
- Left empty, the report stays the full Profit & Loss of all warehouses. Compare with and View: Month by month are for all warehouses only.
To see every warehouse side by side, turn on Show per warehouse (with Warehouse empty). A table appears below the report with one row per warehouse that sold in the period, Total of all warehouses, then one line Costs, other income and journals other than sale notes (not split per warehouse) and Net profit (whole shop), which equals the Net profit of the report. The table is in the PDF and Excel too.
Cost of goods sold breakdown
While the Production feature is on, there is a Cost of goods sold breakdown choice above the report. Switch it on to see what the cost of goods sold of the period is made of. It is off by default, so Profit & Loss stays short.
Under the Cost of Goods Sold line, indented lines appear:
- Material: Rambut Sintetis, Material: Lem and so on: each material used to produce the goods sold, and each material a menu item marked Made when ordered took on its notes (see Café guide). Materials sent by the customer do not count, as they carry no cost. A half-finished material made in the shop shows as one material.
- Piece-rate wages and Outside work (makloon): the stage wages and the makloon of production orders. See Piece-rate wages.
- Production salaries and Factory costs: the share of the fixed wages and factory costs typed in Monthly factory costs.
- Production use: Lakban and so on: each item taken out with a Production use stock adjustment.
- Goods bought finished: goods bought and sold without being produced.
- Empty gallons back: the empties a customer swaps with a gallon exchange, lowering the cost of goods sold.
- Opening stock without breakdown: the opening stock of produced goods, whose make-up was never recorded.
- Other (no breakdown): cost of goods sold that does not come from note lines, such as goods sent with a delivery note and consignors' goods.
The lines always add up to the cost of goods sold, to the rupiah. When splitting one note leaves a rounding remainder, it goes to the largest part.
The make-up is worked out the same way as the average cost. Example: 50 pcs of eyelashes are made at Rp 500 a pcs (materials only), then 50 pcs are bought finished at Rp 700 a pcs. The average cost is Rp 600, and 10 pcs sold afterwards book Rp 3.500 of goods bought finished and Rp 2.500 of materials.
The make-up stays right when something is changed later: the quantities, materials or costs of a production run, Monthly factory costs, production use, a backdated purchase, a return, or a voided note. Vende works it out again together with the cost.
The breakdown shows month by month too (every month and Total, on a phone under Details of each card), in the Compare with column, in the PDF and in Excel.
Stock differences in cost of goods sold
By default the cost of goods sold in Profit & Loss is only the cost of the goods sold. Goods damaged, lost or short at a stocktake show once as Inventory Losses under other charges, and goods found extra at a stocktake show once as part of Other Income under other income.
An accountant who works the cost of goods sold out with the periodic (physical) method (opening stock + purchases − closing stock) gets a different figure, because the closing stock already went down by the damaged goods and up by the extra goods. To make the two meet, switch on Stock differences in cost of goods sold above the report. The cost of sales block then holds:
- Cost of Goods Sold: the cost of the goods sold, as usual (with the Cost of goods sold breakdown under it when switched on).
- Cost of Property Sold: for a property shop, when it moved in the period.
- Inventory Losses: moved from other charges.
- Stocktake surplus (+): the extra goods of stock adjustments booked to Other Income, such as the Selisih opname and Kelebihan hitung categories, written negative because it lowers the cost of sales. Other Income keeps the rest, and its line goes away when nothing is left.
- Total cost of sales: the sum of all the lines above. Gross profit = Net sales − Total cost of sales.
Example: in October the cost of goods sold is Rp 20.000.000, Inventory Losses Rp 500.000 and the stocktake surplus (+) Rp 200.000. By default gross profit is worked out from Rp 20.000.000, with Rp 500.000 under other charges and Rp 200.000 under other income. With this choice the total cost of sales is Rp 20.300.000, the periodic method's figure, so gross profit is Rp 300.000 lower.
The figure matches the periodic method exactly when goods only come in and go out through purchases, sales, losses and stocktakes. Goods that go out to another account still lower the closing stock but are not in the total cost of sales: the adjustment categories Personal use (Owner Drawings), Used in the shop (an expense), Samples/promotion and free goods on a sale (Promotion Expense). The same goes for stock that came in as Opening stock (Paid-in Capital). An accountant who uses the periodic method moves those amounts herself; they show under other charges, expenses and the Balance Sheet, and each one has its own line in the Cost of goods sold calculation.
Net profit stays the same. The same amounts only change place: the Rp 500.000 taken off under other charges is now taken off in the cost of sales, and the Rp 200.000 added under other income now lowers the cost of sales. Nothing is counted twice, and the journals and accounts do not change, so the Balance Sheet and the other reports stay the same.
The choice works month by month (with the change of Total cost of sales in percent), in the Compare with column, on a phone, in the PDF and in Excel, and it stays while the same page address is opened again, like the other report choices.
Cost of goods sold calculation
An accountant who uses the periodic (physical) method usually writes the cost of goods sold out from opening stock to closing stock. Switch on Cost of goods sold calculation above the report to see that calculation below Profit & Loss, with the same columns. It is off by default.
- Opening stock: the value of the goods at the start of the period.
- Purchases: the value of the purchase notes before discounts, then Purchase discounts (note and line discounts), Purchase returns, and Freight and other purchase costs from Purchase Costs. Their sum is Net purchases. Goods received before their note come in in the month they arrived, with the order's discount; when the supplier's note is priced differently from the order, the difference changes Purchases, not Purchase returns.
- Goods that came in or went out other than by being sold, each on its own line and only when there are any: Inventory Losses, Stocktake surplus (+), Production wages and costs (piece-rate wages, makloon, production salary and factory costs that went into the cost of what was produced), Production use, Opening stock, Personal use, Used in the shop, Samples/promotion and free goods, the shop's own adjustment categories by their account, and Other.
- Goods available for sale: the sum of all the lines above.
- Closing stock: the value of the goods at the end of the period, written negative because it is taken off.
- Cost of Goods Sold: goods available less closing stock, exactly the cost of goods sold in the report.
A negative figure lowers the stock. The stock is read from the journals of the Inventory, Goods Not Yet Received (goods whose note was entered but that have not arrived), Goods Delivered Not Yet Billed and Work in Process accounts. When more than one of them holds goods, the opening and closing stock are split by account under them. Goods moving between those accounts, such as on receipt or when sent with a delivery note, do not count as coming in or going out.
Example: opening stock in October Rp 45.000, purchases Rp 52.000 with a Rp 2.000 discount, purchase returns Rp 5.000, freight Rp 1.800, inventory losses Rp 5.100, stocktake surplus (+) Rp 10.200 and personal use Rp 5.100. Goods available for sale Rp 91.800, closing stock Rp 71.400, so the cost of goods sold is Rp 20.400.
Cost of goods sold whose cost never sat in the stock, such as consignors' goods sold or a manual journal to the cost of goods sold, shows as Cost of goods sold not from stock under Cost of goods sold from stock, so the result still equals the cost of goods sold in the report.
While Stock differences in cost of goods sold is on as well, Inventory Losses and the stocktake surplus (+) are already part of the cost of sales, so they have no lines of their own, and the calculation ends on Total cost of sales, the same as the accountant's periodic method figure. In the example above the total cost of sales becomes Rp 15.300.
Month by month, every month runs from its own opening stock to its own closing stock, and the Total column from the first month's opening stock to the last month's closing stock. The calculation works in the Compare with column, on a phone (under Details on each card), in the PDF and in Excel, and together with the Cost of goods sold breakdown.
Categories under categories
Expense and income categories may have a parent, and Profit & Loss shows the same layout. A parent's figure is the sum of its whole family. Each level is indented one more step, its name and its figure alike, so a parent's figure stands one step right of its children's.
Example: Toko Berkah used to record all pay on Salaries, then created Salary Andi and Salary Budi under it. This month:
- Operating Expenses Rp 10.000.000
- Salaries Rp 10.000.000
- Salaries (no breakdown) Rp 6.000.000
- Salary Andi Rp 2.500.000
- Salary Budi Rp 1.500.000
- Salaries Rp 10.000.000
The line Salaries (no breakdown) is what was recorded on Salaries itself, for example before Salary Andi and Salary Budi existed. It only shows when the parent has records of its own and a child moved. Categories that did not move in the period are not shown, so a parent whose children were still shows as one plain line.
Changing a parent or moving a category to another part shows in the report at once, earlier months included. The net profit stays the same. See Expense categories.
Example
Toko Berkah, October:
- Net sales Rp 30.000.000.
- COGS Rp 21.000.000, so the gross profit is Rp 9.000.000.
- Total expenses Rp 4.500.000.
- Total other charges Rp 300.000.
- Total other income Rp 100.000.
- Net profit Rp 4.300.000.
Things to remember
- Profit is not the money in the drawer. Profit & Loss counts things when they happen, not when the money comes in. An unpaid note still counts as a sale, and an unpaid expense still counts as an expense. For the real money, see Cash Balance, or Cash Flow while the Cash Flow extra feature is on.
- Buying stock is not an expense. The goods you buy only become COGS when they are sold.
- The owner's capital does not affect the profit. Contributions and withdrawals (drawings) show in the Balance Sheet, while the Balance Sheet extra feature is on.
- Expenses outside the business can be kept apart. Open Master Data → Expense Categories, then choose Non-operating Expenses as the category's parent. Or open a top category and turn on Under other charges (outside the business). The category and its children move from Expenses to Other charges, including the expenses of earlier months. The net profit stays the same, only the place of the line changes.
- Operating income can go in Sales. For income from the day-to-day business recorded under Transactions → Finance → Income, such as a commission, put its category under Operating Income. That income then counts in Net sales and Gross profit. See Recording income outside sales.
- Opening stock needs to be recorded. If goods are sold before their opening stock is recorded, their COGS is not right yet. The dashboard reminds you with the Record Opening Stock button, and of products made from a recipe sold before their production is recorded with the Record Production button. Serial-numbered goods sold with their serial to follow are reminded with the Record Purchase button; once their purchase or opening stock is recorded, their COGS is worked out again. See Sell first, serial to follow.
- Branch follows the branch choice at the top of the screen. See How to read Vende reports.
Tip: Want to know which goods or notes make the most profit? While the Profit by Item & by Note extra feature is on, see Profit by Item and Profit by Note.
Supporting reading
Articles on the background and the arithmetic.
- Ongkos Kirim dan Biaya Bongkar: Ikut Dihitung ke Harga Modal Cara membagi ongkos kirim dan biaya bongkar muat ke harga modal tiap barang, supaya harga jual dan laba yang terlihat di laporan sesuai kenyataan, dengan contoh pembelian satu truk.
- Laporan Laba Rugi Sederhana untuk Warung dan Toko Kecil Cara menyusun laporan laba rugi sederhana untuk warung, dari penjualan sampai laba bersih, dan cara membacanya setiap bulan.
- Cara Menghitung Laba Bersih Toko Setiap Bulan Urutan menghitung laba bersih bulanan toko: penjualan, HPP, laba kotor, biaya, sampai laba bersih, dengan contoh angka toko kecil.