
Reading the Balance Sheet
The Balance Sheet shows what the shop owns, what it owes and how much the owner's equity is at the end of one day.
On this page
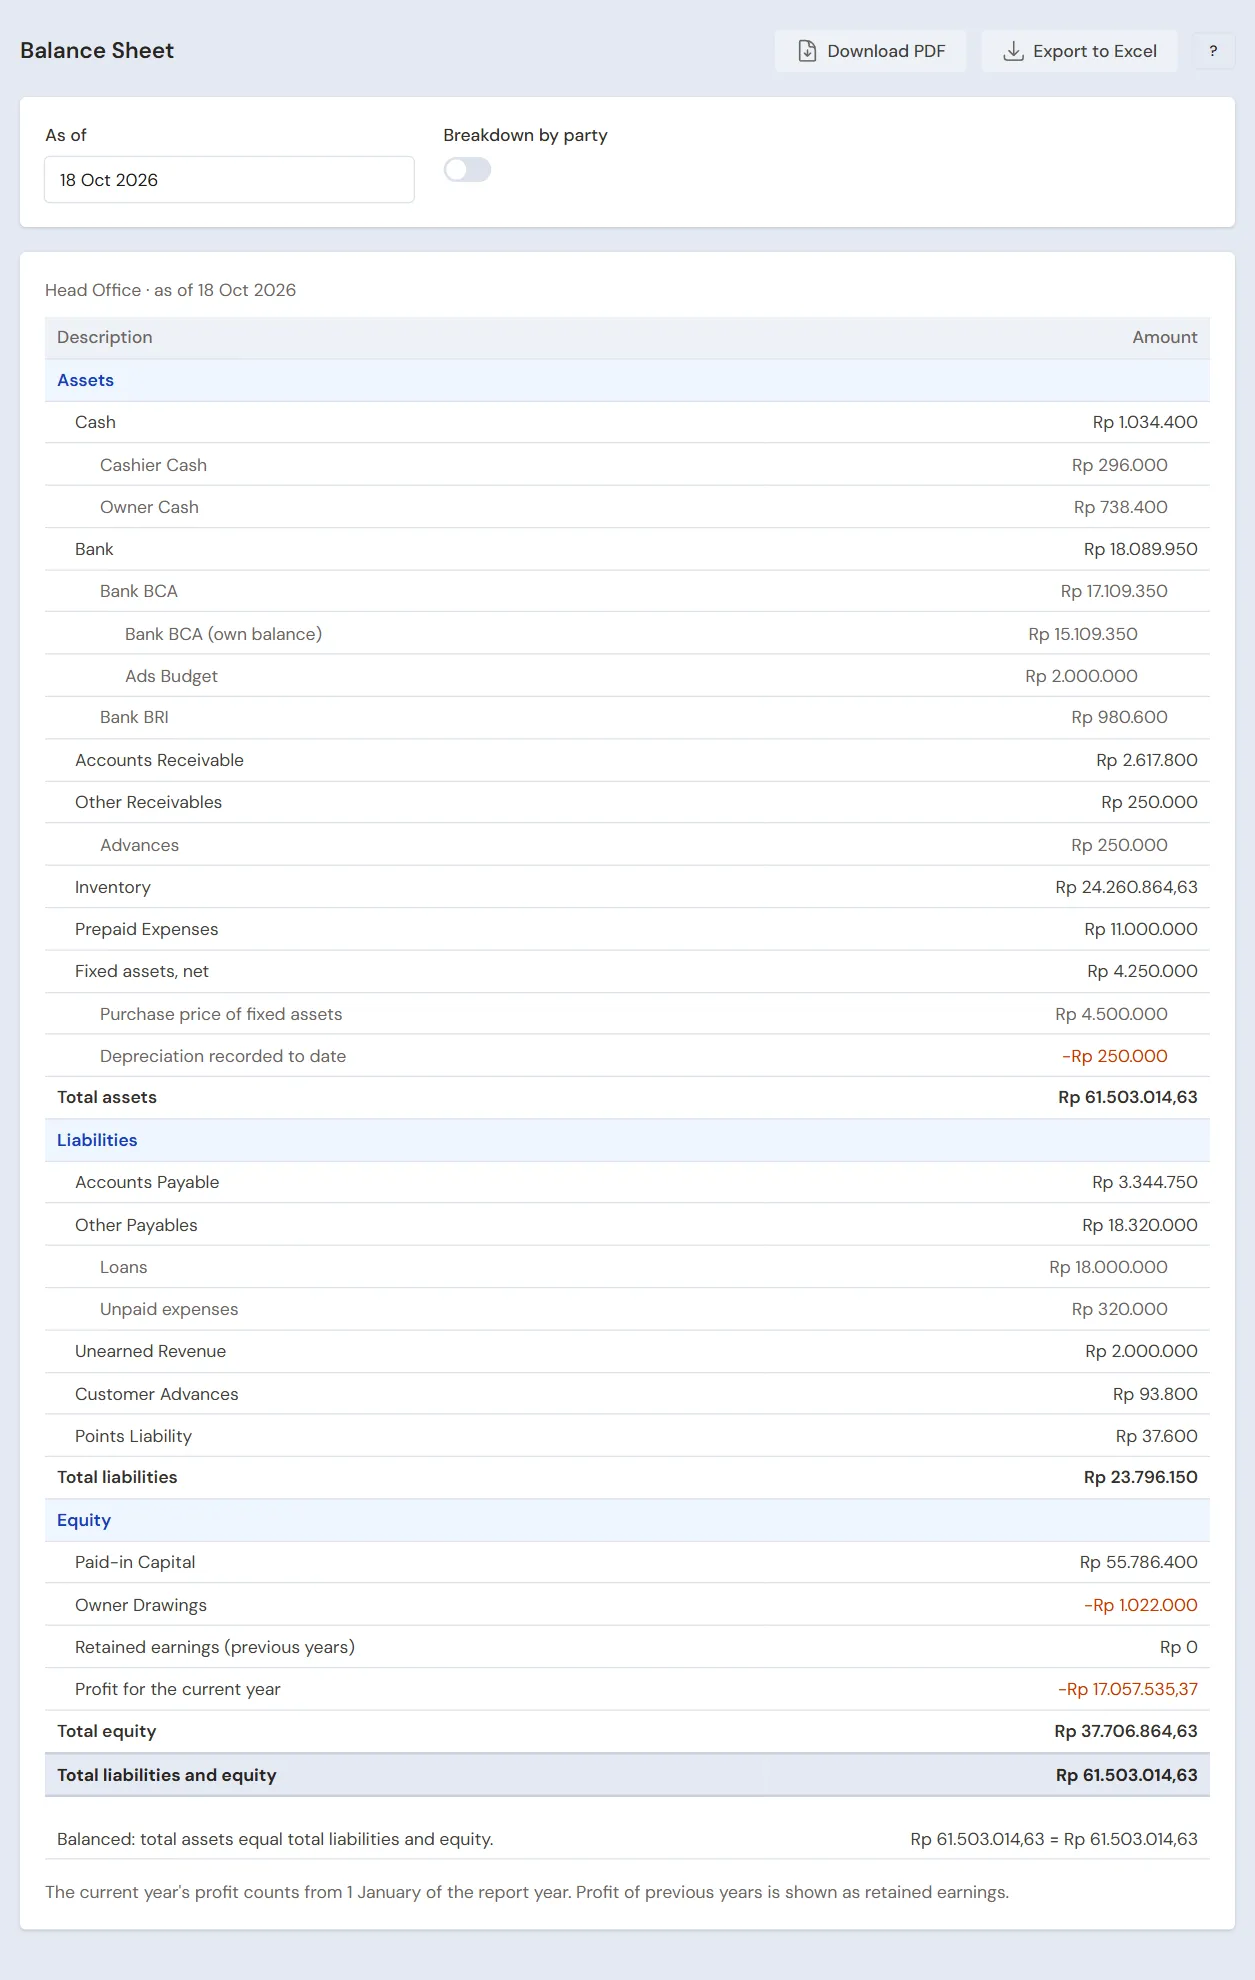
The Balance Sheet is a snapshot of the shop's finances on one day. Open Reports → Balance Sheet, then choose As of. The figures are the position at the end of that day. The Balance Sheet is only open to holders of the Sensitive Reports role. See Roles and permissions.
The breakdown of a line, for example the cash accounts under Cash, is indented, both the names and the figures. The figure of a line like Cash stays at the far right, in line with the total, and each level of breakdown below it moves one step to the left. See Indented rows.
This is an extra feature. If its menu is missing, contact the Vende team to switch it on.
The three parts of the Balance Sheet
Assets
What the shop owns:
- Cash: the sum of the cash accounts of type Cash (notes and coins), with each account listed below it.
- Bank: the sum of the cash accounts of type Bank (bank accounts and digital wallets), with each account listed below it. This line shows when a bank account has a balance.
- Accounts Receivable: what customers owe from unpaid notes.
- Inventory: the stock value, worked out with the average cost price.
- Fixed assets, net: Purchase price of fixed assets less Depreciation recorded to date.
- Other lines when they have a balance, for example Other Receivables for advances and income not yet received, and Prepaid Expenses for what is left of prepaid expenses.
The cash accounts under Cash and Bank follow the order in Master Data → Cash Accounts, and only the accounts with a balance are listed. An account with children, such as budgeting pockets under their bank account, shows its own balance plus its children's, the same as the balance at the bank. Below it comes its own part, for example Kas BCA Hugo (own balance), then each child, one step further in. See Budgeting pockets under a bank account.
Below Other Receivables its parts are shown with their amounts: Advances and Income not yet received. A part with a zero balance is left out.
The sum is Total assets.
Liabilities
What the shop still has to pay or to provide:
- Accounts Payable: what the shop owes suppliers from purchase notes.
- Other lines when they have a balance, for example Other Payables for loans and unpaid expenses, Customer Advances for credit balances and order down payments, Tax Payable, and Unearned Revenue.
Below Other Payables its parts are shown with their amounts:
- Loans: money the shop borrowed from people, a cooperative or a bank.
- Unpaid expenses: expenses and prepaid expenses recorded but not paid yet.
A part with a zero balance is left out. Together the parts equal Other Payables. Customer credit balances and down payments stay on the Customer Advances line.
The sum is Total liabilities.
Equity
The owner's share:
- Paid-in Capital: capital contributions and opening balances.
- Owner Drawings: money the owner took out. It reduces the equity.
- Retained earnings (previous years): the profit of past years that stays in the shop.
- Profit for the current year: the profit since 1 January of the report's year.
The sum is Total equity.
Breakdown by party
Turn on Breakdown by party above the report to see who or what is behind the receivable, payable and advance figures. These lines open into a list of people, companies or categories with their amounts:
- Accounts Receivable and Customer Advances: per customer. The advances hold credit balances and order down payments.
- Accounts Payable and Advances to Suppliers: per supplier, including the freight and shipping still owed to couriers.
- Other Payables: Loans per lender. Unpaid expenses per supplier, and expenses without a supplier per expense category.
- Other Receivables: Advances per borrower. Income not yet received per supplier, and income without a supplier per income category.
- Prepaid Expenses: what is left of prepaid expenses, per expense category.
A category shows with its full name, for example Operating Expenses › Marketing. An expense moved to another category shows under its new category, on past dates too.
The list is sorted from the largest amount. The sum of all parties always equals the line above it. Notes without a customer show as Walk-in. Records that cannot be tied to one party show as Other.
The screen and Download PDF show the 50 largest parties or categories per group. The rest are summed in one line, for example and 12 other parties. Export to Excel holds every party.
For today and all branches, the line also links to the Receivables or Payables report. Those reports only show today's position, so for another date or a single branch, use Export to Excel to see every party.
The breakdown also works for past dates: the figures are the position at the end of the chosen day. When only one branch is selected, the breakdown follows that branch's records. For example, a repayment received at branch A for a note of branch B is recorded at branch A.
Both sides must match
Total assets always equals Total liabilities and equity. Below the report it says Balanced when they match. If it says not balanced, with the difference, contact the Vende team through a support ticket.
Example
Toko Berkah as of 31 October:
- Assets: cash Rp 3.000.000, bank Rp 12.000.000, receivables Rp 3.000.000, inventory Rp 40.000.000. Total assets Rp 58.000.000.
- Liabilities: accounts payable Rp 8.000.000.
- Equity: Rp 50.000.000, made up of paid-in capital, drawings and profit.
Rp 8.000.000 plus Rp 50.000.000 equals Rp 58.000.000. The Balance Sheet balances.
Changes in Equity
The Balance Sheet shows equity on one day. Reports → Changes in Equity shows how that equity changed over a period. Choose From and Until, or press a quick period such as This month or This year. This report uses the same extra feature and permission as the Balance Sheet.
- Opening equity: Total equity in the Balance Sheet on the day before the period.
- Capital and opening balances: the movement of the Paid-in Capital account in the period: money the owner put in under Owner's Capital, and the opening balances (cash, receivables, payables, stock) booked as opening capital.
- Profit (loss) for the period: net profit in Profit & Loss for the same period and branch. A loss shows negative.
- Owner Drawings and own use: the movement of the Owner Drawings account: money the owner took out and goods taken for personal use. The figure is negative because it reduces equity.
- Other changes in equity: changes of other equity accounts, for example manual journals. This line only shows when there is one.
- Closing equity: opening equity plus all the changes above.
Closing equity always equals Total equity in the Balance Sheet on the Until date. The branch chosen at the top of the screen applies to every figure.
Example: opening equity Rp 50.000.000, capital deposited Rp 10.000.000, profit for the period Rp 6.000.000, owner drawings Rp 1.500.000. Closing equity is Rp 64.500.000.
Things to remember
- The Balance Sheet figures are read as the current and quick ratio in Financial Ratios.
- Vende does not make year-end closing journals. Last year's profit is worked out and shown as retained earnings.
- The inventory value uses the same average cost price as the Stock report. A difference of a few rupiah can appear because of rounding.
- The profit for the current year equals the net profit in Profit & Loss from 1 January to the report date, for the same branch.
- For the Balance Sheet, the Profit and Loss and their notes as one printable pack, use Financial Statements and CALK.