
How to read Vende reports
All reports are in the Reports menu: choose a branch and dates, read the result, then download a PDF or an Excel file when needed.
On this page
You read all of the shop's figures in the Reports menu. You do not need to put reports together yourself. Vende reads them from every note, payment and document already recorded.
The reports
- Money: Cash Balance, Cash Flow, Cash Book, Bank Reconciliation and Cashier Shifts.
- Profit and loss: Profit & Loss, Profit by Item and Profit by Note.
- Shop position: Balance Sheet, Financial Ratios, Changes in Equity and Fixed Assets & Depreciation (when the Fixed Assets feature is on).
- Receivables and payables: Receivables, Receivable Card, Payables and Payable Card.
- Stock: Stock, Stock Card, Negative Stock History, Stock Movement Summary, Reorder Suggestion and Cost of Goods Sold Proof.
- Tax: Tax Collected, and VAT when the VAT feature is on.
- Budget: Budget vs Actual.
- Accounting: General Journal, General Ledger, Trial Balance and Worksheet, when accounting mode is on.
Every shop has the basic reports: Cash Balance, Stock, Stock Card, Profit & Loss, Payables, Receivables, Payable Card and Receivable Card. The other reports in this list are extra features. If a menu is missing, contact the Vende team to switch it on.
The reports you see follow your roles. The cash, receivable, payable and tax reports are open to the Finance Manager, the stock reports to the Warehouse Manager, and Reorder Suggestion to the Purchasing Manager. Profit & Loss, the Balance Sheet, Financial Ratios and the other profit reports are only for holders of Sensitive Reports. General Reports and the Auditor open the other reports. What each role holds cannot be changed. To open other reports, ask a holder of User Manager to give you an extra role in Settings → Users. See Roles and permissions.
Choosing a branch
Reports follow the Branch choice at the top of the screen. Choose one branch, or All branches for the whole shop. This choice appears when the shop has more than one branch. The line above the report always names the branch and the period you are reading.
Choosing dates
There are two kinds of report:
- Period reports, such as Profit & Loss and Cash Flow. Fill in From and Until. By default they run from the start of this month until today.
- Position reports, such as Cash Balance, Balance Sheet and Stock. Fill in As of. The figures are the position at the end of that day.
Receivables and Payables have no date choice. Both always show today's position.
Quick period buttons
Every period report has one row of buttons above its dates: Today, Yesterday, Last 7 days, This month, Last month, Last 3 months, This year and Last year. One press fills in From and Until. The button of the period on screen is lit, also when you pick those dates yourself. On a phone the choices are in one Period menu.
- This month and This year run until today.
- Last month and Last year are a whole month or a whole year.
- Last 3 months holds this month and the two months before it, until today. For example on 19 October: 1 August to 19 October.
For any other period, pick the dates yourself. Profit & Loss also has a Last 12 months button (this month and the eleven before it, until today), View to read its period month by month, and Compare with. See Profit & Loss month by month and Comparing with another period.
The report is worked out again every time you change a filter. Dates and times follow the branch's local time.
Filters by what the rows carry
Besides the dates and the branch, a report can be filtered by what its rows carry. A filter is offered only in the reports whose rows really have that attribute:
- Warehouse: Stock, Profit & Loss, Profit by Note, Profit by Item, Receivables, Payables and the other stock reports.
- Customer, Customer group and Sales agent: the reports of sale notes (Profit by Note, Profit by Item, Prescription Sales, Sales by Hour) and Receivables. Cashier (who rang the note up) is only in the sale note reports, not in Receivables. Sales agent shows while the Sales feature is on.
- Category and Brand: Stock, Stock Movement Summary, Negative Stock History, Reorder Suggestion and Profit by Item.
- Supplier: Payables, Reorder Suggestion and the supplier promo claims report.
- Cash account: Cash Book and Bank Reconciliation.
Left empty it means All, so the total of everything still shows. What you picked is written under the report's title, in the PDF header and in the Excel title rows, so a report sent to someone else says what it was filtered by. Filters are kept in the page address, so a copied or reopened page shows the same filters.
Not every amount can be split by an attribute. For example salaries and electricity are booked per branch, not per warehouse, so the Profit & Loss of one warehouse only separates sales, cost of goods and gross profit, and the part that cannot be split is written on its own. See Profit & Loss per warehouse. A report whose figures must equal one account of the whole shop, such as VAT and Tax Collected, does not have these filters.
Indented rows
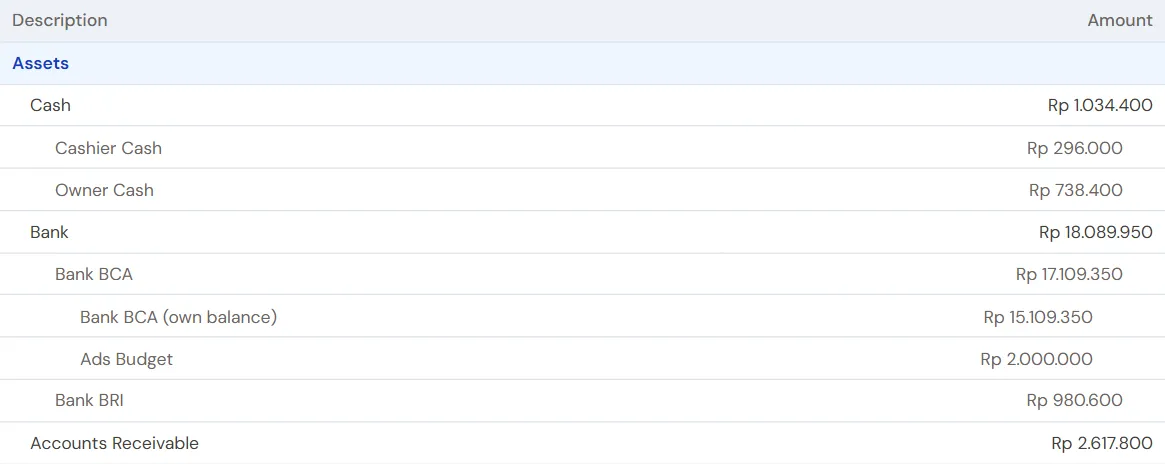
Reports that have breakdowns, such as Balance Sheet, Profit & Loss, Budget vs Actual, Stock, and the expenses or income per category in Payables and Receivables, indent their breakdown rows. The name of a breakdown row moves to the right, and its figure moves to the left, one step for each level. The figure of a total always sits further to the right than the figures of its breakdown, so the two are easy to tell apart.
For example in the Balance Sheet: the Cash and Bank figures sit at the far right, in line with Total assets, the figure of each cash account below them sits one step to the left, and a budgeting pocket under its bank account one step more. In Profit & Loss, the figure of each top category under the Expenses heading sits one step to the left, its children one step more, and Total expenses sits at the far right. PDFs indent in the same way. On a phone the steps are smaller, so long figures still fit on one line. In an Excel file the figures stay straight in one column, and the names of child categories start with spaces.
Empty parts are not shown
Reports made of several parts, such as Payables, Receivables, VAT and Collections per Collector, only show the parts that have something in them. A part with nothing in it does not appear at all, nor its title, its table head or its total. When every part is empty, the report is one sentence, for example No payables as of 19 Oct 2026. The PDF and the Excel file follow the screen.
If "Costs are being recalculated" appears
This message appears when a stock document has just changed, so the cost of the goods needs working out again. The cost, inventory and profit figures are temporary for now. Vende recalculates by itself, usually within a few minutes. Whoever changed the document is told through the bell when it is done.
Downloading
Every report has a Download PDF button. Many reports also have Export to Excel. See Excel and PDF exports.
Tip: Want to know where the report figures come from? Read How Vende keeps the books behind the scenes.
Supporting reading
Articles on the background and the arithmetic.
- Laporan Laba Rugi Sederhana untuk Warung dan Toko Kecil Cara menyusun laporan laba rugi sederhana untuk warung, dari penjualan sampai laba bersih, dan cara membacanya setiap bulan.
- Laporan Penjualan Harian: Lima Angka yang Dicek Tiap Malam Lima angka dari laporan penjualan harian yang cukup diperiksa lima menit sebelum tutup toko: omzet, jumlah nota, rata-rata belanja, barang terlaris, dan selisih kas, dengan contoh hari biasa.