
Reading the stock reports
See stock quantities and values, one item's in and out history, the items that went negative, a movement summary, and reorder suggestions from the Reports menu.
On this page
There are six stock reports in the Reports menu. By default, they are open to the owner and the Warehouse Manager. Reorder Suggestion is open to the owner and the Purchasing Manager. Holders of the General Reports and Auditor roles can open all of them too. The Batch Tracing report (for recalls, in the Reports menu when the Batches & expiry feature is on) is described in Batches and expiry.
Stock Movement Summary, Reorder Suggestion and Cost of Goods Sold Proof are extra features. If their menus are missing, contact the Vende team to switch them on.
Stock: quantity and value
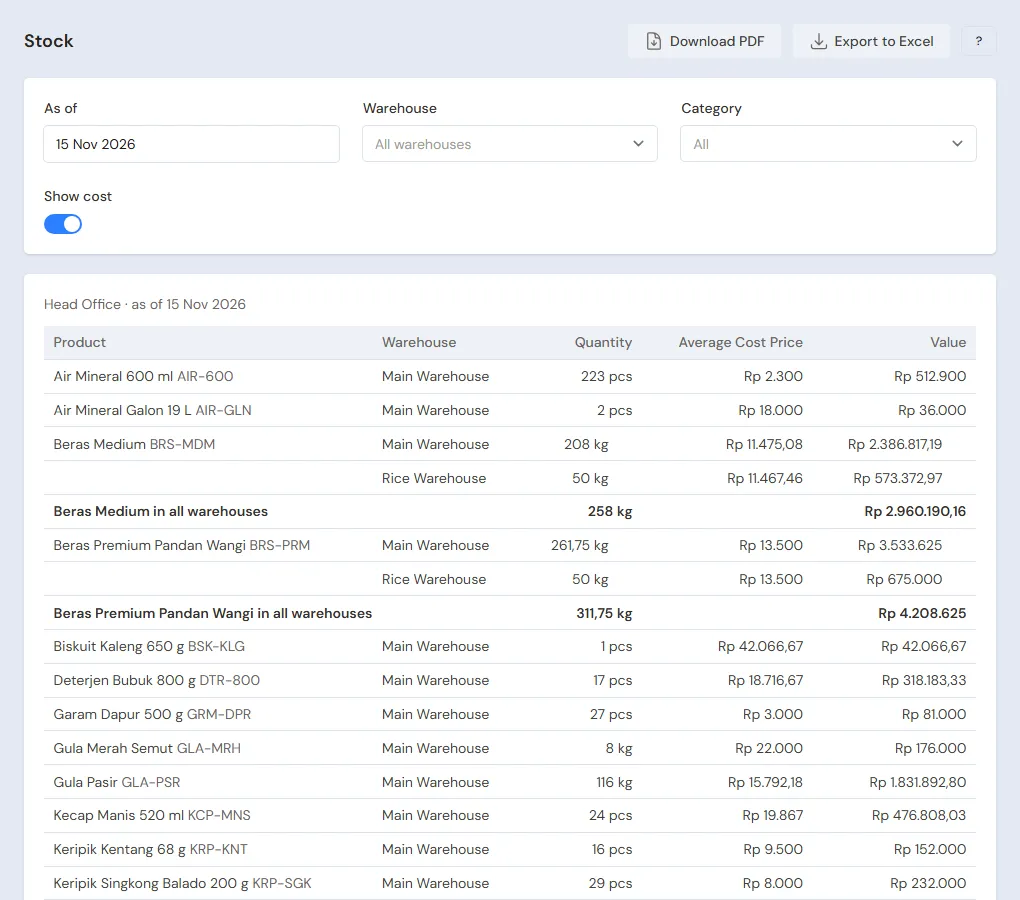
Reports → Stock shows each item in each warehouse at the end of the chosen day.
- Choose As of.
- Limit it to one Warehouse, Category or Brand if needed. Stock Movement Summary, Negative Stock History and Reorder Suggestion have the same filters.
Each item shows with its quantity, cost price and value, then the Total stock value at the bottom. Value = quantity × average cost price on that date. Cost prices and values show while Show cost is on. See Printing stock without cost prices.
-
Items that have a main unit show in that unit, for example 17 Packs 12 Sticks.
-
A negative quantity means the item was recorded going out before its incoming goods were recorded. Usually its opening stock has not been entered yet. To see everything that ever went negative, including what a purchase has covered since, open Negative Stock History.
-
While the Product variants feature is on, switch on Sum variants per parent to show all the variants of a parent product as one line. See Product variants.
Stock Card: one item's history
Reports → Stock Card shows every movement of one item.
- In Product, type the item's name or code, then choose the item.
- In Warehouse, choose one warehouse, or leave it empty for all warehouses.
- Fill in From and Until.
It holds: the quantity before the period, every movement (sale, purchase, transfer, adjustment) with the quantity in, the quantity out and the running balance, then the quantity after. Press a document number to open it.
Pick a parent of variants (marked all variants) to see the movements of all its variants on one card, with a Variant column on each line.
Goods that went out while the warehouse's stock was already negative are marked Negative stock under their document (in Excel: the Note column). It is explained in Negative Stock History.
Stock Movement Summary
Reports → Stock Movement Summary sums up one period: the Start of Period stock, the goods In by type, the goods Out by type, then the End of Period stock, with their values.
Choose Group by to sum up per Item, Category or Warehouse.
Negative Stock History
Reports → Negative Stock History keeps track of goods that were sold or taken out before their stock was recorded. Once a purchase or opening stock fills the gap, the stock looks normal again and the gap shows in no other report. This report still shows it.
- Fill in From and Until.
- Choose one Product or one Warehouse, or leave them empty for all.
Each time stock went negative (one item in one warehouse) is one heading row:
- Went negative: the date the stock first dropped below zero.
- Covered: the date the stock came back to zero or more, with the document that covered it, for example a purchase. Not covered yet means the stock is still negative.
- Lowest stock: the lowest the stock reached during that time.
Under the heading is every outgoing document recorded while the stock was negative, with the Quantity out and Below zero, the part that went past the stock on record. The report lists the times still open in that period, with the outgoing goods dated in that period. Press a document number to open it.
Holders of Sensitive Reports also see three cost columns, while Show cost is on:
- Cost Used: the cost per unit now recorded on that outgoing line.
- Estimated Covering Purchase Cost: the average price of the purchases, production output or opening stock that covered the part below zero. A cover without a price, such as a transfer or a return, covers the quantity without giving a price. While no purchase has covered it, the estimate is empty.
- Difference: (estimate - cost used) × the part already covered, only for outflows made wholly while the stock was already negative (an outflow that partly came from stock is left empty, because its cost is a blend). The cost used is the average across all warehouses, so a difference appears when only one warehouse went negative while the item is still in stock in another. It is a price gap, not an error in the cost. When a transfer, return or adjustment covered it, the line says the cover had no purchase price.
Goods that are sold without stock by design, made from a recipe or made when ordered like a café menu, are not listed; look at their Stock Card if needed. To close a negative that is still open, record the opening stock or the purchase that was not recorded.
Printing stock without cost prices
Stock, Stock Card, Stock Movement Summary and the three cost columns of Negative Stock History have a Show cost switch. It is on by default. Switch it off to give the warehouse team a stock list without cost prices.
- Open the report and set its filters.
- Switch off Show cost.
- Press Download PDF or Export to Excel.
Cost prices, values and the total value are gone from the screen, the PDF and Excel. The quantities stay. Stock Movement Summary becomes per item with its quantities only, because categories and warehouses can only be added up by their value.
Cost prices in the stock reports count as sensitive reports. The switch shows only to holders of the Sensitive Reports role, for example the Owner and the Auditor job title. The Finance Head job title holds it too; tick General Reports as well if they need to open the stock reports. Everyone else, the Warehouse Manager, General Reports and the Store Head included, sees the quantities only, in the PDF and Excel too. Cost prices elsewhere (the product list, stock adjustments and movements, their exports) follow the same rule: see Cost price of goods. Cost of Goods Sold Proof is a sensitive report as a whole, because it is a cost calculation. Negative Stock History stays open to the Warehouse Manager; without Sensitive Reports it shows quantities only. Reorder Suggestion keeps its purchase prices and values, because it is used to order from suppliers; an item with no price from a supplier yet uses the cost price for holders of Sensitive Reports and Rp 0 for everyone else.
Reorder Suggestion
Reports → Reorder Suggestion works out the goods to buy for one warehouse, grouped by main supplier. Each item shows with Stock Now, On Order and Suggested. The Create Purchase Order button on a supplier's row makes a draft purchase order from that suggestion.
How to use it is in Reorder Suggestion.
Cost of Goods Sold Proof
Reports → Cost of Goods Sold Proof shows how Vende works out the cost of goods sold (COGS) of one product: every incoming item with its price, and the outgoing items at the average cost price of that moment.
Below it, the cost of goods sold by the stock card is compared with the bookkeeping. Matches means they are the same. This report helps answer the question "why is the COGS of this item this much?". Outgoing lines recorded while the warehouse's stock was negative are marked Negative stock in the note column (in Excel: the Note column). Their cost is the average the books use; the Negative Stock History report compares it with the purchase price that covered them. See Negative Stock History.
This report is a sensitive report: it only opens for holders of Sensitive Reports, for example the Owner, the Auditor job title and the Finance Head. The Warehouse Manager, General Reports and the Store Head do not open it.
Supporting reading
Articles on the background and the arithmetic.