
Seeing your sales results
Follow your sales from the dashboard, the note list, the lines of goods sold, and the profit per item, of one item and per note.
On this page
Vende does not have just one "sales report". Pick the place that fits your question.
Dashboard: today's summary
The Dashboard opens with a greeting card: today's date, the branch you are using, and the New sale and New purchase buttons. Below it:
- Sales today, Sales this month, Notes today and Average note this month. Each figure carries the percentage up (green) or down (red) against the period before: today against yesterday up to the same hour, this month against the same dates last month.
- Sales target, then Gross profit this month and the receivables and payables due this week.
- The alerts, then the cards and charts: sales over the last 30 days, Payment methods this month (money received from customers per Cash, Transfer, QRIS and Card), Sales and expenses over the last 6 months (net sales and total expenses as bars, net profit as a line, the same figures as Profit & Loss per month), Customers of this month (how many new customers, returning customers and walk-in notes, then the five customers who bought most), Best sellers of this month (the five goods or services with the largest sold value and their quantity), Latest transactions (the most recent posted notes with what is still outstanding), sales per category, busy hours, per sales agent, per sales channel, Sales per branch this month (every branch you may use, against the same dates last month), Stock and slow movers (the stock value and the number of products in stock, the same as Reports → Stock, then the five goods that sold least over the Slow-Moving Goods days of Settings → Alerts), and Cash Balances.
A new customer is one whose first posted note in the shop (at any branch) falls in this month. A customer who bought before, opening receivable notes included, counts as returning.
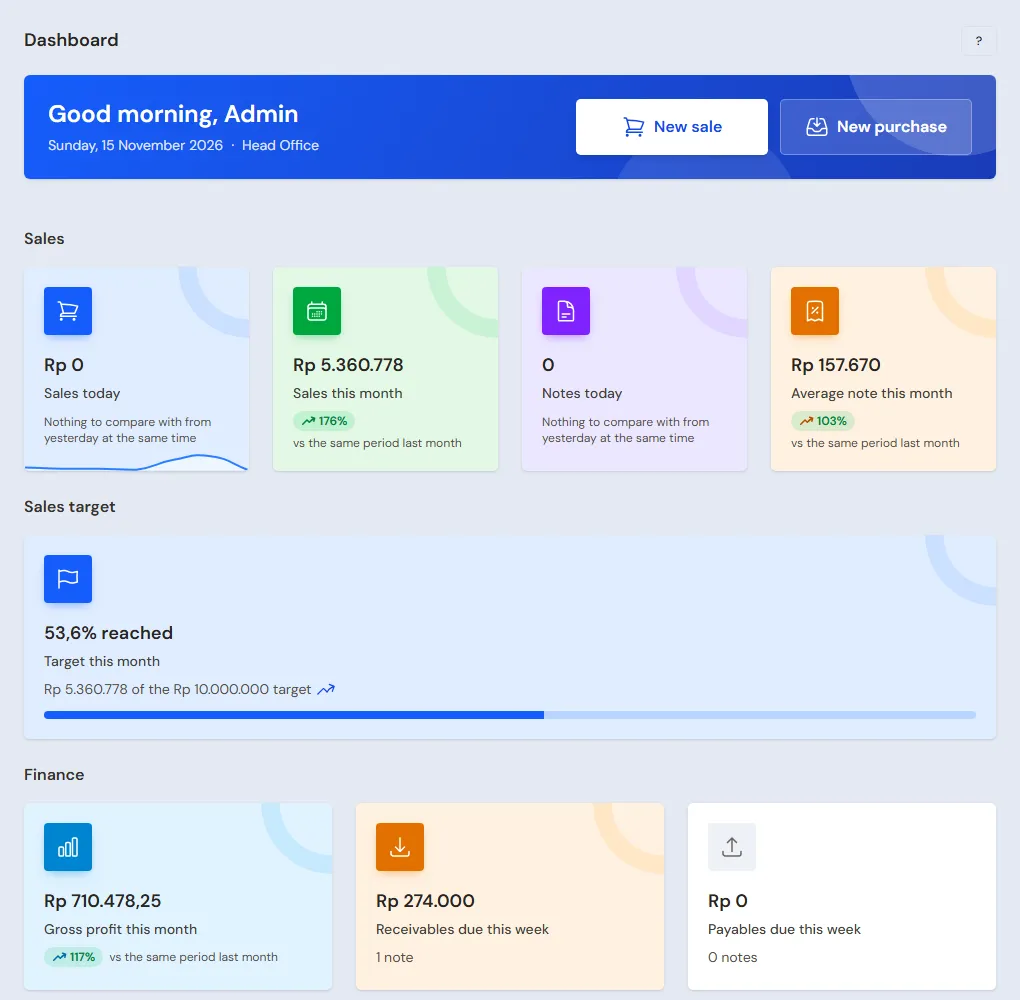
The cards you see follow your role, the branch you picked and the shop's features that are on. Sales figures are for the Cashier Manager, stock for the Warehouse Manager, finance for the Finance Manager. The Stock value, Gross profit this month and Sales and expenses over the last 6 months are for Sensitive Reports holders only. Sales per sales agent shows only while Sales agents is on, per channel while Sales channels is on, and per branch while Several branches is on and you may use more than one branch. A card that does not apply to you leaves no empty space.
On a computer the sales figures stand four in a row and the cards three in a row (a chart over time takes two thirds of a row). On a tablet the cards stand two in a row, and on a phone the sales figures stand two in a row with the other cards one under another. The cards and charts load after the page shows, so the dashboard opens fast. The stock value and the 6-month chart are kept for up to 5 minutes. With Reverb on, the figures change by themselves when a note is posted, voided or returned, when money in or out is recorded, or when stock moves, at most once every 30 seconds and only while the dashboard tab is visible (a tab that was hidden refreshes once when it becomes visible again). Without Reverb the figures are worked out once when the page opens; reload the page for the latest.
Opening the details from the dashboard
The figures and charts on the dashboard can be tapped to open the list or report that holds their details, already filtered to match that figure:
- Sales today and Notes today open Transactions → Sales with today's posted notes. Sales this month and Sales target open this month's posted notes.
- Gross profit this month opens Reports → Profit & Loss for this month. Receivables due this week opens Reports → Receivables, and Payables due this week opens Reports → Payables.
- On the Sales over the last 30 days chart, tap a day to open that day's notes. On the Sales per sales agent chart, tap an agent's bar to open their notes of this month, or tap their row in the Target vs actual per sales agent (this month) table. On the Sales per category chart, tap a category slice to open its goods sold this month in Transaction Details → Sale Lines. The Category filter there, like the chart, leaves out gallon or container deposits, since a deposit is the customer's money, not a sale. Others and No category open nothing.
- Average note this month opens this month's posted notes. On Payment methods this month, tap a slice to open Transaction Details → Sale Payments received this month that way.
- On Sales and expenses over the last 6 months, tap a month to open Profit & Loss for that month. See details opens Profit & Loss for the six months.
- Under Best sellers, tap a product to open its lines sold this month in Sale Lines. Under Customers, tap a customer's name to open their notes of this month, or See details for the customer list. Under Latest transactions, tap a note to open it. On Sales per channel, tap a channel's bar to open its notes of this month. Under Stock and slow movers, tap a product to open its Stock Card, or See details for the Stock report. The branch chart cannot be tapped, because the note list follows the branch you picked.
- See details on each chart opens the chart's whole period. Busy hours opens the notes of the last 30 days, because the note list cannot be filtered by hour.
- Under Cash Balances, tap an account name to open that account's Cash Book for this month, or See details for the Cash Balance report. An account with pockets opens the Cash Balance report, because its balance on the dashboard includes its pockets, while that account's Cash Book holds only its own balance.
- Under Alerts, tap a product name to open its Stock Card, an order number to open the order, or a cash account name to open its Cash Book. See details under a warning opens its report: Stock for low stock, Receivables or Payables for overdue notes and loans, and Cash Balance for balances outside their limits.
- Under Attendance today, tap Checked in or Late to open their attendance records of today in Transactions → Attendance. Not in yet, On leave and Absent cannot be tapped.
The list or report that opens follows the branches picked on the dashboard. Its filters can be changed or cleared as usual. A figure whose details page you may not open still shows, but cannot be tapped.
The note list
Transactions → Sales holds every note. How to search for and open notes is in Finding and opening sales notes. Press the funnel icon to filter by date, branch, customer, sales agent, sales channel or status.
The rows below the list add up the posted notes: This page (posted notes) and All sales (posted notes). These sums follow the filters.
Goods sold
Transaction Details → Sale Lines holds every line of goods from every note. The Sold tab holds the goods sold. The Returned tab holds the goods customers returned.
Use this list to see who bought a certain item and at what price. Filter by item, category and date. The money total below the list follows the filters. For that item's profit on each note, use Profit of one item.
For a question like "how many Gula Pasir 1 kg did we sell this month?", use Profit by Item.
Profit by Item
Profit by Item and Profit by Note are extra features. If their menus are missing, contact the Vende team to switch them on.
Reports → Profit by Item shows, for each item in the period: the quantity Sold, Net Sales, COGS, Gross Profit and Margin (%). The items with the largest gross profit are at the top.
Choose Group by to sum up per Item, Category, Brand, Customer, Customer region (while the Sales feature is on), Sales agent or Sales channel. The region is read from the customer's region today, see Regions and the Sales in charge. The Sold column only appears when grouped by item. While the Product variants feature is on, choose Parent product (variants summed) to add up all the variants of a parent product in one line.
Profit of one item
Want the sales history of one item, for example how often it sold this month and what it earned? Pick it in the Item field, or press the item's name in the list. Type its name, code or barcode to search. Services and inactive items can be picked too. A removed item stays in the list, but its history cannot be opened.
The report then shows every note of that item in the period: Date, note Number, Customer, Quantity, Selling Price, Net Sales, Cost, COGS, Gross Profit and Margin (%). A returned item shows on a row of its own marked Return, with negative figures. The Sales agent column appears when some note has a sales agent. Above the table are the item's category, brand, quantity sold and quantity returned.
Selling Price and Cost are per base unit of the item, after discounts and without tax. On the total row both are averages. The totals of this report equal the item's row in the list of all items.
With product variants, pick the parent product (marked all variants) or press its name in the Parent product (variants summed) list. Its history holds every variant, one row per note and variant, with a Variant column (S, Black, say).
With the Service staff commissions feature on, the list has two more columns: Staff Pay (the commission of that item's service lines) and Profit After Staff Pay. Items that are not services have a pay of 0. The figures are explained under Profit by Note.
While one item is picked, Group by is hidden. Clear the Item field to go back to the list. Download PDF and Export to Excel hold that item's history.
Profit by Note
Reports → Profit by Note shows each note with its Net Sales, COGS, Gross Profit and Margin (%).
Use the Margin filter to find problem notes:
- All notes;
- Thin or negative margin, with the limit you set in Thin margin limit (it starts from Settings → Alerts, 10% by default);
- Negative margin only.
Profit by Note and Profit by Item can also be filtered by Warehouse, Customer, Customer group, Sales agent (while the Sales feature is on) and Cashier (who rang the note up). Profit by Item has the item's Category and Brand too. The filters can be used together, left empty means all, and what you picked is written in the PDF and Excel header. Prescription Sales and Sales by Hour have the same note filters. See Filters by what the rows carry.
Service staff pay
With the Service staff commissions feature on, this report has two more columns: Staff Pay and Profit After Staff Pay. Example, a CCTV project on one note with 8 points at Rp 40.000 a point: Staff Pay is Rp 320.000, and Profit After Staff Pay is the Gross Profit less Rp 320.000. That way the profit of each project shows in full.
Staff Pay is the commission of that note, taken from the same source as the Service Staff Commissions report, so the two always agree. A voided note has no pay. The commission reaches Profit & Loss as an expense when it is paid through Pay Commission, not when the note is made, so Profit After Staff Pay is only for reading a project's profit and never changes Profit & Loss. The Margin filter still uses Gross Profit. The columns are in the PDF and Excel too. Without the feature the report looks as before.
The figures come from each note's bookkeeping, the same as Profit & Loss. Tax, service charge, tips and shipping are not part of net sales. Income recorded under an income category whose Block is Operating income counts in the gross profit of Profit & Loss, but not here, because it does not come from a note.
Sales KPI: EC, NOO, RO, and AO
If the extra Sales activity feature is on and the Sales KPI is switched on in Settings → Sales Activity, Reports → Sales KPI holds the distributor's figures per salesperson. When Contacts and visit purposes is on too, an Activity table adds new people, introductions given, contacts who became customers, days without a sale and activity points. See Sales activity. What each abbreviation means is written under the table and in the PDF and Excel:
- EC (Effective Call): a visit that ended in an order. Filled when the salesperson checks in under Today's Visits.
- NOO (New Open Outlet): customers that salesperson registered in the period, read from the Registered by field on the customer. It is filled in with the logged-in user's sales agent when a customer is added (on the customer form or with + New customer on the sales screen).
- RO (Repeat Order): customers who bought through that salesperson in the period and had already bought before the period.
- AO (Active Outlet): distinct customers who bought through that salesperson in the period; a customer counts once however often they bought.
RO and AO are counted from sales notes whose Sales Agent field holds the sales agent linked to that user, the same as Sales value. Cancelled notes, opening balances and sales without a customer do not count towards AO; a customer whose only earlier note is an opening balance (brought from the old system) still counts as returning in RO. A user not yet linked to a sales agent in Master Data gets zero for NOO, RO and AO.
Tax Collected
If the extra Taxes on the note feature is on and the shop collects tax on notes, Reports → Tax Collected shows the tax from notes per month and per tax. Below it are the tax paid in during the period and the tax payable at the end of the period.
Tip: Free goods from a promotion are booked as Promotion Expense, not as COGS, so they are not counted in Profit by Item. The charge shows in the Other charges part of Profit & Loss.
Supporting reading
Articles on the background and the arithmetic.
- Jual di Bawah Modal Tanpa Sadar: Cara Mengeceknya Harga beli naik sementara harga jual tetap membuat barang laku tetapi merugi. Cara menemukan barang seperti itu sebelum menumpuk kerugian.
- Laporan Penjualan Harian: Lima Angka yang Dicek Tiap Malam Lima angka dari laporan penjualan harian yang cukup diperiksa lima menit sebelum tutup toko: omzet, jumlah nota, rata-rata belanja, barang terlaris, dan selisih kas, dengan contoh hari biasa.